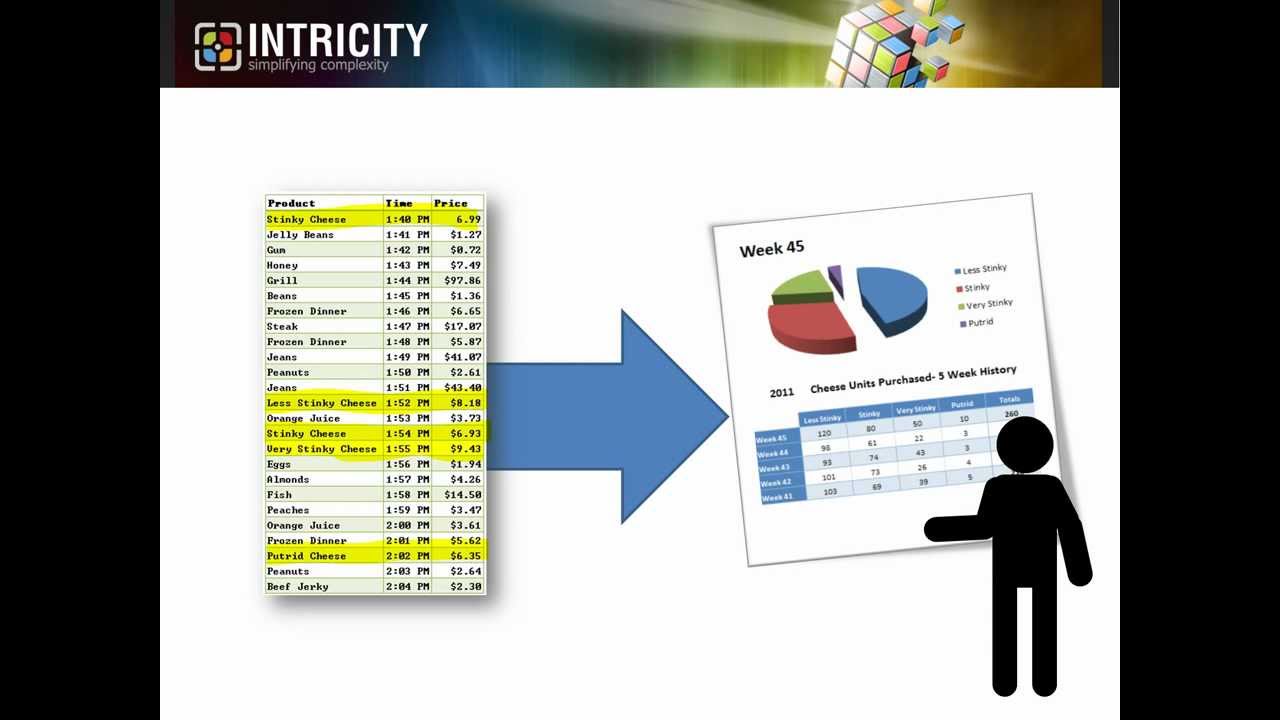
Ive, been in the Business Intelligence space for over 10 years now, but I still find it hard to carry on small talk with the average Joe about what exactly I do for work. So for all the Joes out there that really want to know what Business Intelligence is. You’ve found the right place. First, I want you to imagine that you went to your favorite store to buy some stinky cheese. When you pay for your cheese and walk out, you may or may not know that your favorite store has gathered some new data about the stinky cheese you bought at what time you bought it and how much you bought it for Now. I want you to put yourself in the shoes of the Director of Stinky Cheese Supply for your favorite Store. Day in and day out. He has to figure out how many blocks of stinky cheese. He should be ordering The only possible way for him to make an educated guess about. This is if He knows how many are being purchased by customers.
Now, as the data sits today, the Director of Stinky Cheese would have to look at every single transaction made throughout each day to see how much stinky cheese was purchased. But this takes up way too much time, and since this is a decision, the Director of Stinky Cheese has to make every week He decides to use a Business Intelligence tool to provide that information. The use of a Business Intelligence tool allows for information to be regularly rolled up and formatted just right, so the Director can make a much more educated decision about how much stinky cheese to purchase Additionally, now that the Director has more time on his hands, He can Analyze in much further detail, So basically you can think of Business Intelligence as the process of going from raw data to legible information. Now consider how broad the Business Intelligence space is. For Example, Have you ever received a receipt from an ATM machine that provides you a current balance in your bank account Or perhaps have you ever received a detailed bill in the mail? These are all forms of Business, Intelligence, ( or BI )
Lets take some time and go over some common forms of BI. First lets talk about Operational Reporting. This form of reporting is a kin to the detailed bill in the mail or your ATM receipt. It provides a very structured template of how the data is to be delivered to the end user. The end users experience needs to be considered in a lot more detail as the path of analysis and how the person will consume. The data are typically nested in the report templates. Second, we have Ad Hoc reporting. This type of reporting is intended to empower a business person to play the report authoring role. By doing this, the look feel and content of the report can be controlled by its consumer.

Most Ad Hoc tools have built in assumptions regarding design and navigation to keep the business person from getting overwhelmed with complexity, The queries and their structures are maintained by IT and are developed jointly with business user inputs. Third, we have OLAP Analysis. This type of analysis delivers pre, calculated and pre. Structured data sets for business people to explore Many tools that connect to OLAP feel more. Like data navigation tools than pure report, authoring tools, I’ve released a much more comprehensive video about OLAP on the Intricity101 channel, which is titled What is OLAP? Fourth, we have Data Visualization. This is a category that has recently emerged in popularity and covers a realm in BI, which I like to call micro decisions In Data Visualization. The roll up of data is commonly conducted, algorithmically and stored in memory. This makes the experience of BI far more plug and play in nature, And it also allows the business to answer one off questions in a much simpler way, Because the roll up of the data commonly occurs automatically. It also tends to be very processor and query intensive
Fifth, we have Dashboards As you would expect. Dashboards typically represent a high level view of an organization. This keeps the executive from having to thumb through hundreds of reports and data elements. If a troubled area arises in the dashboard, the executive can drill into the alert to see a more detailed report. Often dashboards are simply compositions of the various data delivery methods. We just discussed Each of the delivery methods. I’ve described above typically come as part of a suite or platform for managing the various forms of content. This means everything from scheduling automated report delivery to keeping the data secure, are all conducted in a single platform. Now, I’m sure there are another dozen or so forms of Business Intelligence. This video is not meant to cover every way you could consume data, But hopefully you can get a sense of some common ways. Businesses are turning raw data into comprehensible information. However, the Business Intelligence front end is really only the tip of the iceberg. The real work in delivering consistent information happens behind the scenes in Data Marts and Data Warehouses.
Commonly if a business is unhappy with their Business Intelligence tool, something is usually wrong in the back end Data Warehouse. Now that you’ve watched this video, I recommend you take a look at my video on Data Warehousing just so. You have a good understanding of how important that data foundation is. Intrinsically has lead the way in Business Intelligence since, before the industry had a common name. We have a long list of very enthusiastic customer references about our Business Intelligence capabilities and we have been the pioneers in designing the backbones to some of the most popular Business Intelligence platforms. I recommend you visit the Intrinsically website and speak with one of our specialists. We will bring value from day one..